One of the most frequent questions I get is how I’m tracking the information I report, so in this post I’ll go through how we capture and display our cost and travel information. AS A BONUS, at the end of this report is a link where you can get a free copy of my spreadsheet that you can use to plan your trips, track costs and stats, and automatically create maps of your travels.
I was an IT project manager for much of my 40-year career, so using technology to track costs comes as second nature to me. There are many nomadic travellers that don’t bother tracking their spending, but for us it’s a great way to make sure our spending is on track, and it eases our mind when we want to splurge a bit on a travel treat like a cruise.
I did a lot of research into the tools out there to track spending, and have developed a process that’s easy to use and gives us the stats we want. It may not be exactly what you’re looking for, but for us it’s been working well and may give you ideas on what you can do to track your travel expenses.
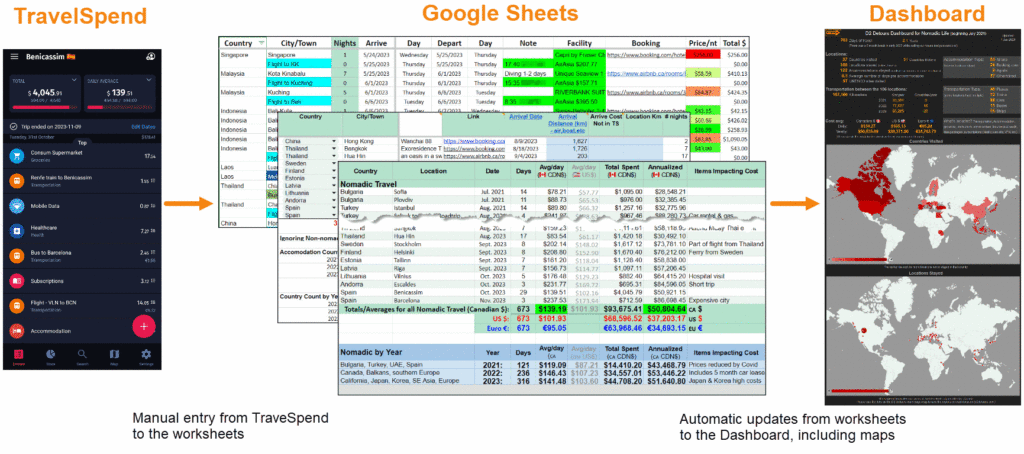
This is our 3-step process, with details below:
- TravelSpend app to capture our day-to-day expenses;
- Google Sheets spreadsheet to record our summarized totals and travel stats for each location;
- Dashboard created in Google Sheets to create a single page summary, including maps.
TravelSpend
There are a number of apps out there to help you track your costs, but we’ve found TravelSpend to be the best for us. On Facebook nomad groups we follow it sounds like it’s the preferred choice for other power-users like us who travel full-time, so it comes pretty highly recommended.
Even if you don’t do all the tracking using spreadsheets like I show below, TravelSpend by itself will help give you more insight into your spending.
Price: You can download the app to your phone and use the free version, which we did for the first few months of our travels, and it works great. We’re now paying about $14 (US$) for an annual subscription that allows us to customize categories and export trip cost data to a spreadsheet, along with some extra statistics and a few other benefits. I also like to support developers when they create something as useful as this. You can find TravelSpend in your Apple or Google Play Store.
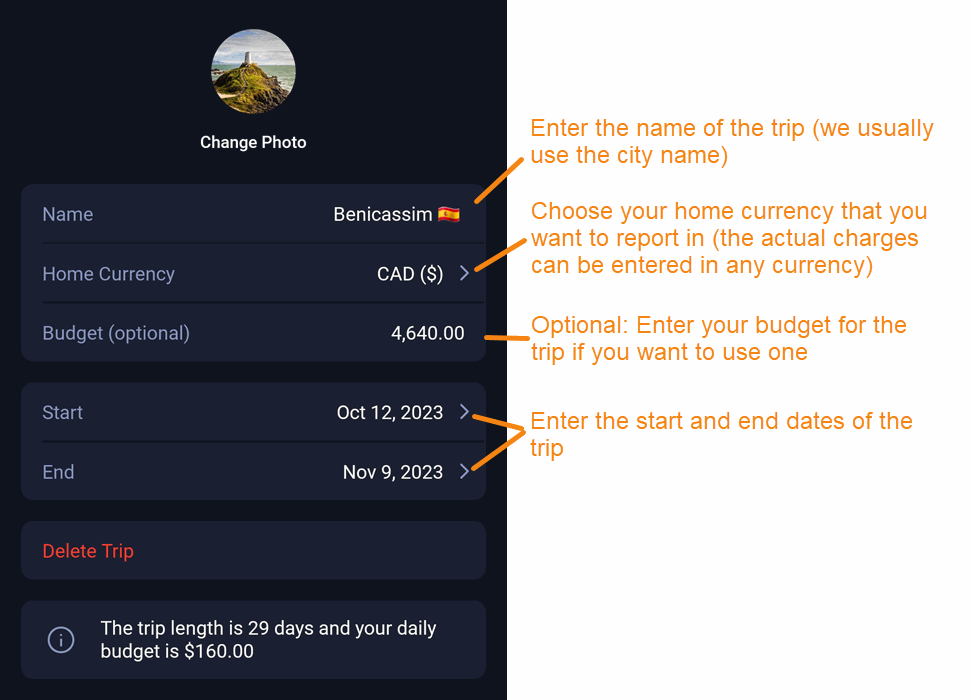
Ease of Use: We generally set up each city we’re visiting as a “Trip” in TravelSpend. Setting this up is as simple as giving the trip a name, entering the “home” currency (for us it’s “Canadian $”), entering the budget for the trip (which is optional) and selecting a start and end date.
For day-to-day purchases we quickly got into the habit of entering them as we were standing at the check-out in a store or restaurant. It’s so fast to enter into the app that we’ve often finished making the entry before the receipt prints out.
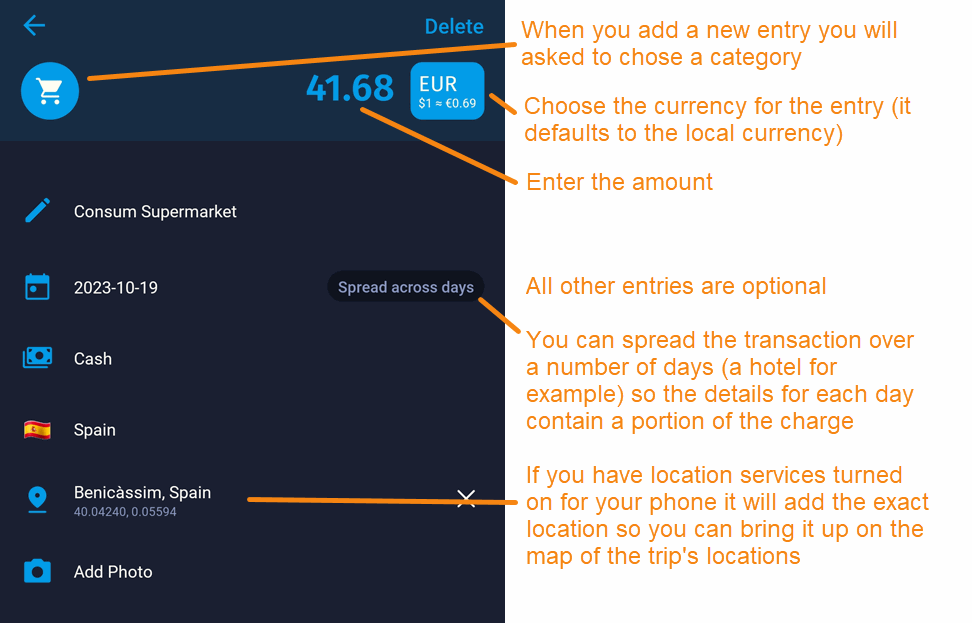
When you enter an expense you can choose the currency, but the app defaults to the local currency of whatever country you’re in when you make the entry (ie: if I’m posting an entry for a future trip in Cambodia, but I’m currently in the US, the app defaults to US $), choose the category (groceries, restaurant, etc.), the amount, and you’re done. Once you complete the entry it will instantly add a conversion to your “home” currency using today’s exchange rate (assuming you’re online) showing you both amounts for your reference. If you don’t have a data package it will automatically update and sync new purchases to anyone you’re sharing with the next time you connect to the internet.
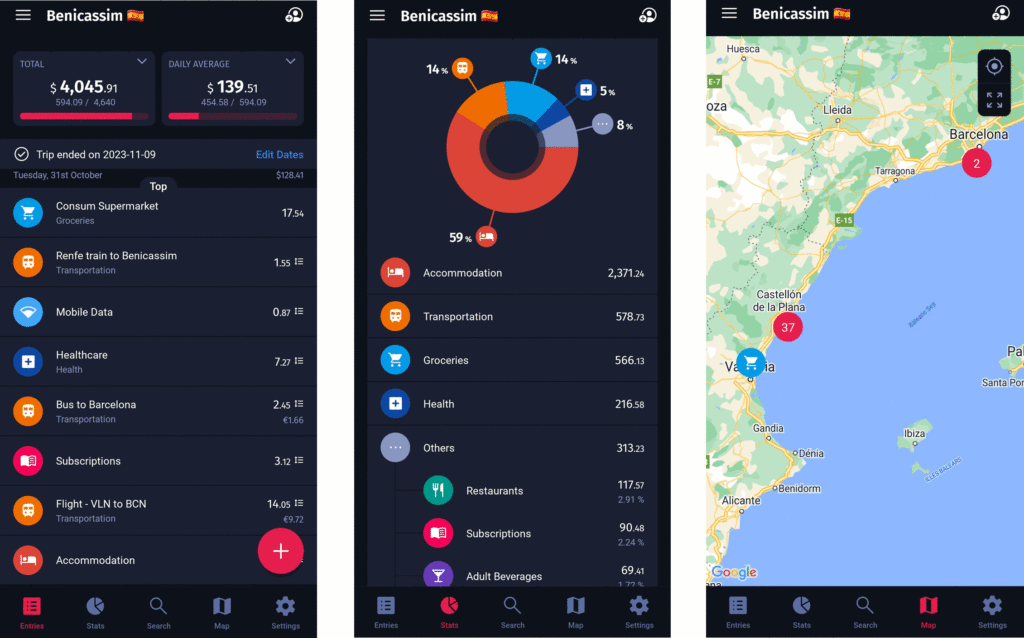
What it gives you: Once you’ve entered a purchase it’s automatically gives you totals for how much you’ve spent so far on the trip, what your daily spending average is, how much you are currently over or under your daily budget, and what you need to spend on a daily basis for the rest of the trip to stay on budget. These last two items are especially handy if you splurged at the start of a trip and want to know how much you can spend each day to stay on track, or how much “fun” money you have to splurge on a treat if you’ve been good and stayed under budget.
Google Sheets
I used Excel when at work, but now that I’m retired and nomadic I’ve converted to Google Sheets. It works almost exactly the same as Excel and has all the same functionality I need for my spreadsheets, but best of all it’s FREE! Other great benefits are the fact that anything I do on the spreadsheet is instantly saved online (no losing data if my computer hangs or I forget to save it) and I can easily access the file on other devices and my cell phone, then share with Whitney or anyone else with a Google account. And yes, you CAN use it offline like I am right now writing this article while on a cruise ship in the middle of the Atlantic ocean without a data package ($25/day US$ for data on the ship – no thanks!). You just have to identify the files you want to use offline so it saves a local copy, and from then on it will automatically sync any of the offline changes once you go back online.
Price: As mentioned above, it’s FREE!!! If you have a Google account (which you do if you’re using Gmail or any other Google product including YouTube), then you already have it ready for your use.
How to access Google Sheets: Just use this link to access your Google drive: https://drive.google.com/drive/, then use the “+ New” icon at the top-left of the screen to start creating a Google Sheet. There are lots of tutorials online you can search for to show you how to use Google Sheets and the other document apps, including Google’s own Google Sheets training and help.
Ease of Use: This is pretty much up to your experience level with spreadsheets. It works almost exactly the same as Excel, and I find it easy to use. Having used spreadsheets most of my career I’m pretty good with them. However, I often want to use functions I can’t remember how to set up, and a simple Google search brings up multiple websites and videos that give me step-by-step instructions, so I’ve found it very easy to do some powerful things in it.
What it gives you: I have a number of worksheets in my spreadsheet that show up as tabs along the bottom, and I use them to track many different details of our travels. Here are my main worksheets, all saved within a single Google Sheet workbook:
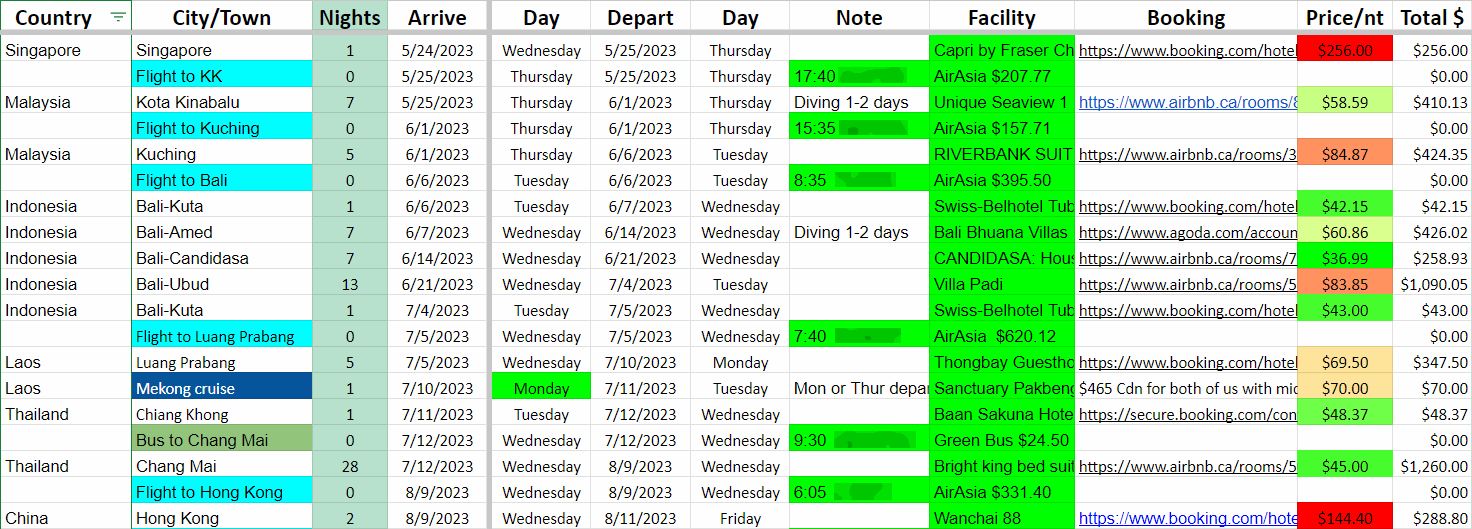
- Planning worksheet: This is where we plan the logistics of our travels including where we’re staying and how we’re getting there. It shows the country, city, number of nights, arrival and departure dates and day of the week, facility name and booking information, and pricing. I’ve also found it handy to add some functionality and color coding to enhance the spreadsheet and make it easy to use:
-
- City/Town automatically highlights in different colors if any of the words “flight, cruise, boat, train, bus, car, ship, or ferry” appear in the cell so our mode of travel is more visible among the accommodation details.
- Arrive and Depart dates and days automatically update by copying the Depart date from the prior row into the Arrive date of the next row, then adding the number of nights for that row to get that row’s departure date. The only date I need to enter is the very first row, then it cascades down and all other rows update as I add the number of nights we’ll stay at a location. The “Day” columns are automatically calculated using a spreadsheet formula that converts a date to the day of the week. I also use conditional rules for certain dates. For example, in the planning worksheet above you’ll see the Monday of the Mekong cruise is highlighted in green. I put a rule on that cell that highlighted it in green if the day was a Monday or Thursday, but red if it was any other day of the week because the cruise we wanted to take only sailed from Luang Prabang on those two days, so we had to make sure our dates lined up correctly!
- Facility (and some Notes) are manually colored bright green by me when I’ve completed booking that item so I know it’s done. I find this critical when I have lots of bookings on the go so I don’t overlook anything.
- Price/nt has conditional formatting programmed on these cells that automatically highlights a price from bright green to red depending on the price of the booking – the brighter the green the better the price. As I’m running my eye down the list I can see where I got a good price for the booking, and as the highlight gets more red I know it’s an expensive accommodation. You’ll notice we don’t stay very long in locations with extremely high rates.
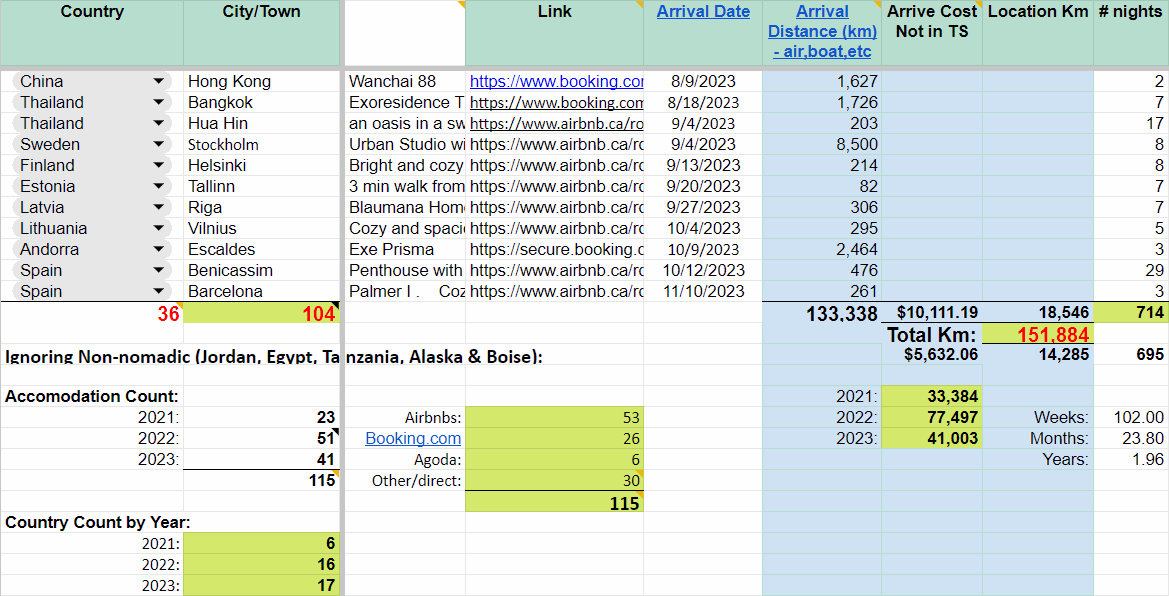
- Travel worksheet: This is where our completed trips are logged, with one row for each location indicating the country, city, how we booked, and the distance travelled to get there. This is a bit of duplication from the Planning worksheet, but this one is entered after we leave the location, and is a lot cleaner as it generally only contains one line per city. I’ve sliced and diced that information in different views at the bottom (countries per year, how we book accommodations, etc.). The items highlighted in green in the bottom half are linked to the Dashboard so when a new row is added in the details for a new location the data on the Dashboard is automatically updated. These totals are automated with specific rules I’ve applied. For example, where I’m counting the type of accommodations I’m simply looking in the column above for cells that have the words “airbnb,” “booking,” or “agoda,” and adding up how many there are.
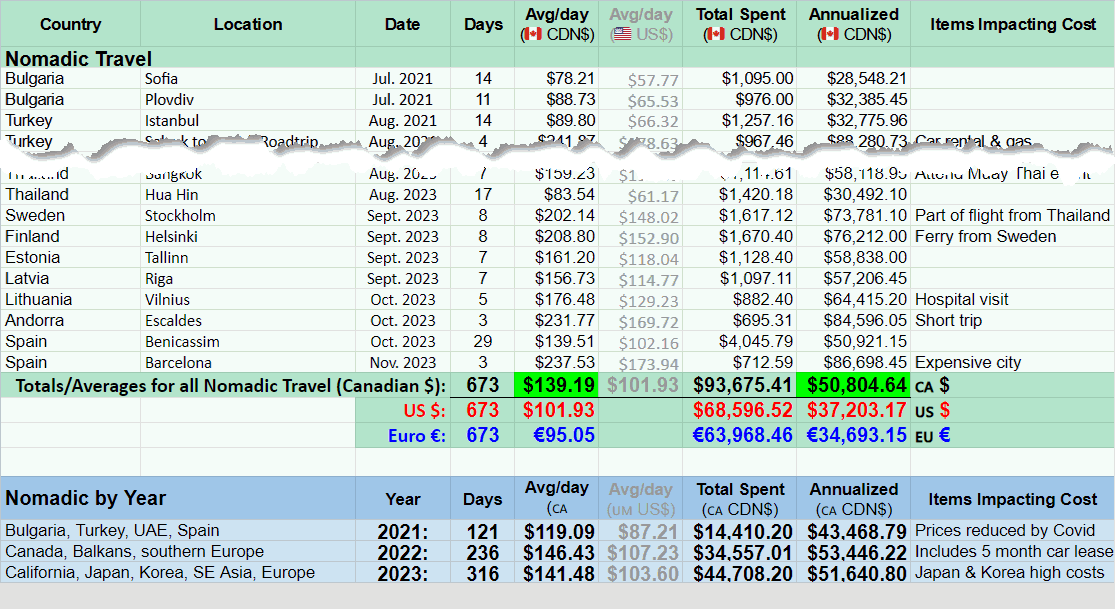
- Cost worksheet: If you’ve looked at our Spending page you’ll recognize this spreadsheet. It’s where we track how much we spend at each location, which I enter directly from the TravelSpend app when we end our stay in a location. The Canadian $, US $, and Euro totals at the bottom are linked to the Dashboard so it automatically updates when I enter the data here.
Dashboard
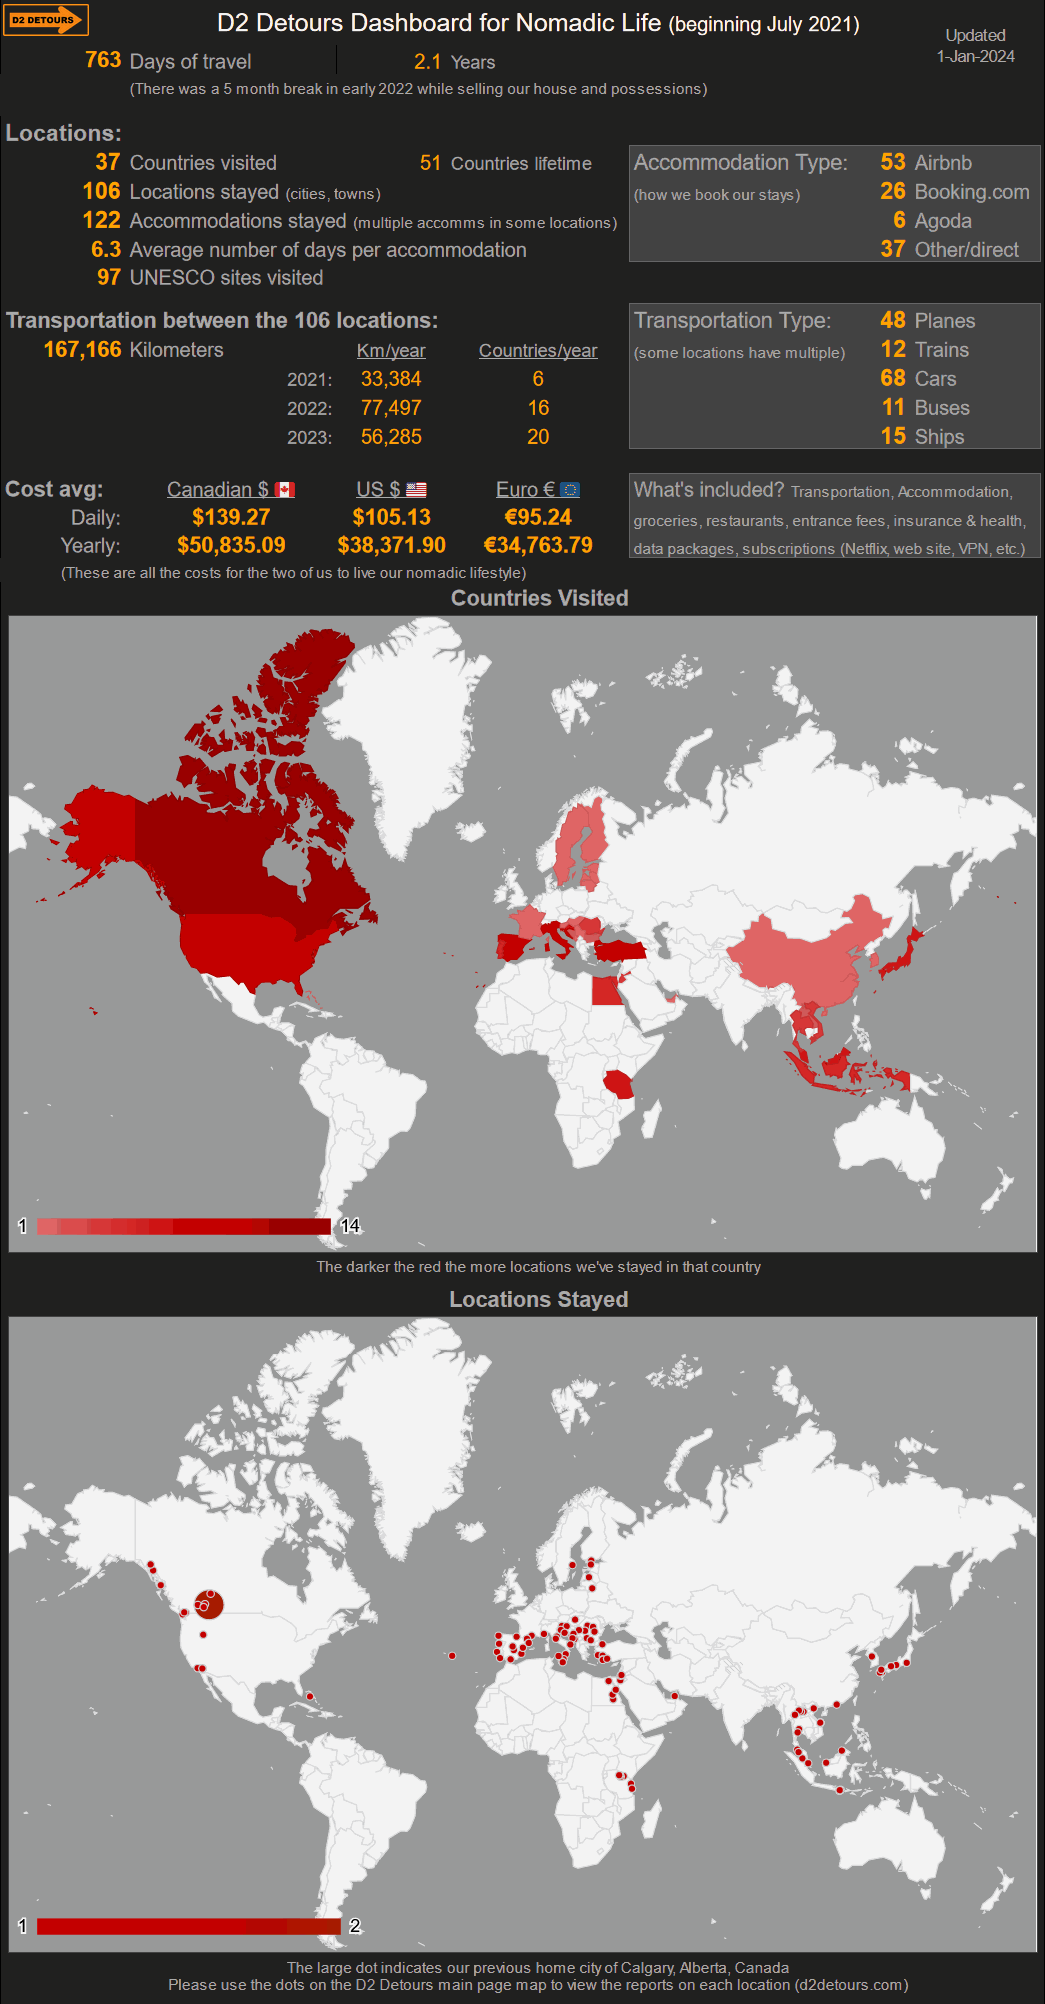
The summarized data I want to look at is spread across a few different worksheets, most of it in the last two worksheets mentioned above, but also one or two figures stored in some other worksheets I use. The Dashboard gives me the figures I’m interested in viewing in one convenient location. There is NO data entered on the dashboard – it is automatically updated when the details are added or edited in the other worksheets.
I also include a couple of maps in the dashboard which are also automatically updated using the Google Sheets Charts functionality – I do NOT need to go in and add anything to these maps – simply adding the country and city to the worksheets mentioned above updates the maps. Here’s the dashboard I created for our D2 Detours travels:
Price: Since this is just another Google Sheets worksheet it’s free.
Ease of Use: If you’ve already created the worksheets with your travel data, creating a dashboard is very simple since it’s just pointing to figures you’ve already calculated on those worksheets… you’ve already done all the work. The hardest part is to figure out what data you want to pluck from your worksheets to display on the dashboard, and deciding what you want it to look like. Try to group the data into logical blocks so it flows nicely and is easy to understand.
For the maps you simply use the Google Sheets Charts function by doing this:
1. Create a Google Sheets worksheet with a list of the countries and cities you’ve visited (for me it’s the Travel worksheet mentioned above), making sure they are spelled correctly otherwise the map won’t be able to figure out where they go. This will be the data source you’ll point to from the map chart so it knows where to get the data to include on the map.
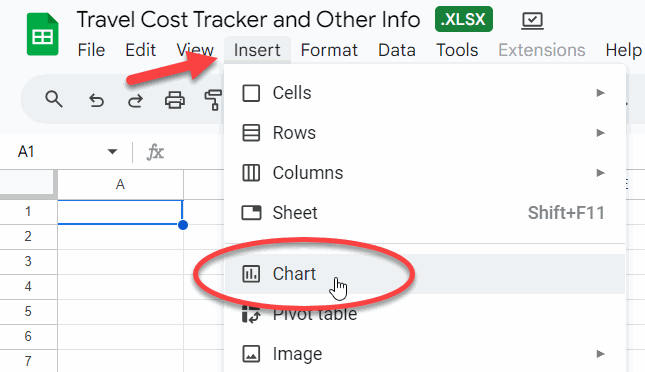
2. Insert / Chart on a worksheet where you want the map to appear.
3. The “Chart editor” window should appear, then in the “Chart type” drop-down menu select one of the two Map charts.
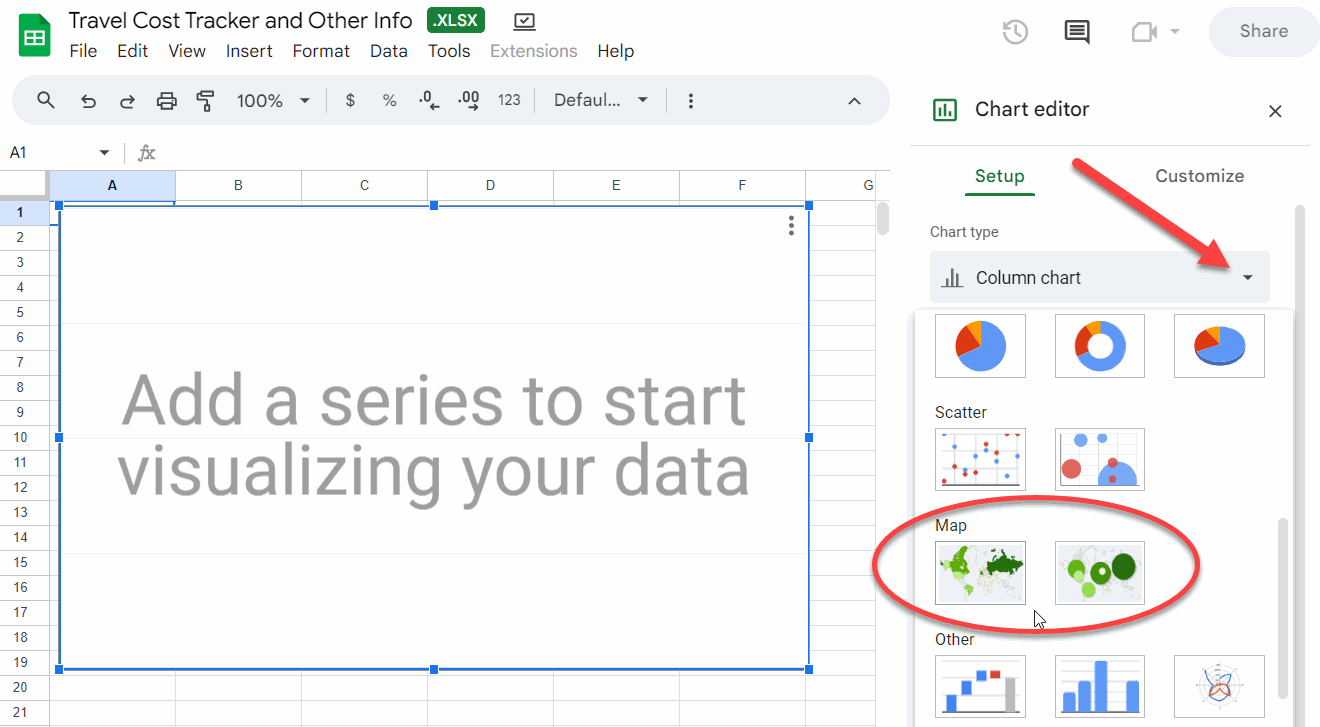
4. In the Chart editor select the data to be used on the map (the countries & cities set up in step #1). View the video below for a demonstration on how I created my maps.
I worked with Robb Hillman in an online session for fellow nomads to demonstrate tips and tricks when creating a map in Google Sheets. You can view the video of that training session here to learn more:
FREE Travel & Cost Tracking Spreadsheet with Maps!!! I’ve used my spreadsheets to create a version suitable for sharing with you. The worksheets have the functionality mentioned above including the ability to create Country and City maps when you enter data into the appropriate worksheets. BONUS: I’m including the worksheet I use to keep track of all the UNESCO sites in the world that you can use to track which ones you’ve visited, as well as a worksheet I find very helpful with weather averages by month for the most popular cities in the world.
Get the Travel & Cost Tracking Spreadsheet by CLICKING HERE
How to save and use the spreadsheet:
- After clicking the link above the spreadsheet should save to your Download area, then you should save it to your Google Drive before starting to work with it.
- If you use it in Excel or any other non-Google spreadsheet program the maps will NOT work, although the other worksheet functionality should operate correctly.
That’s it! That’s how we record and view our costs to keep track of where we are in our spending and track some other stats we’re interested in. Hopefully it gives you some ideas, and feel free to post a comments below or via our Contact page. Good luck with it!
Questions? If you have any questions please feel free to post them on the Facebook post for this entry.
What’s Up For 2024? We’re currently staying with family in the Palm Springs area of California, but we’re travelling to Cambodia and SE Asia the 1st of February, so we’ll be back to our normal travel blogs. Make sure to subscribe here or follow us on Facebook or Instagram to come along!


Bon voyage and safe travels